A Case Study in Individual Stock Risk
As investors, we don’t like surprises. Even if there is a 50% chance of getting a good surprise from our investment, we don’t like the other 50%. We actually hate it, and there is more pain on the downside than happiness on the upside, and we remember pain longer. That’s just human nature.
So imagine how Goldman Sachs (GS) investors felt last week, when on March 14 the company’s value dropped by more than 3% with a market-cap drop of more than $2 billion. Here you are on Tuesday, loving your investment pick in the most highly regarded, savviest and wealthiest investment bank in the world, and on Wednesday you’re greeted by Greg Smith’s front-page op-ed piece in The New York Times.
I worked at GE Capital for some time, and I learned many things there, and one that neither I nor any of my GE colleagues would forget is Jack Welch’s rule that nothing that we do should ever be on the front page of the newspaper. The press would never put the good deeds on the front page but would devote the entire page to bad news.
At GE, we also learned how to be risk-averse. More specifically, we learned how to take calculated risk with our investments — it was all about obtaining a better risk/reward ratio. That’s where my investment training started, and in my current company, Rockledge, I honed my focus on providing superior risk-adjusted returns for my clients by investing not in individual stocks but in sectors. It is widely known and accepted that sectors contribute up to 90% of any individual company’s return.
At Rockledge we focus on sector investing instead of individual stock investing. There are good stock-pickers out there, but they are few, and even the good ones are having trouble providing consistent outsized returns. In the past several years, things got even worse, with high cross-stock and cross-asset correlations, and stock-picking was effectively neutralized. Don’t get me wrong, a stock-picking environment will come back, but we all learned our lessons, and some of us even got hurt by our inability to diversify our own or our client portfolios.
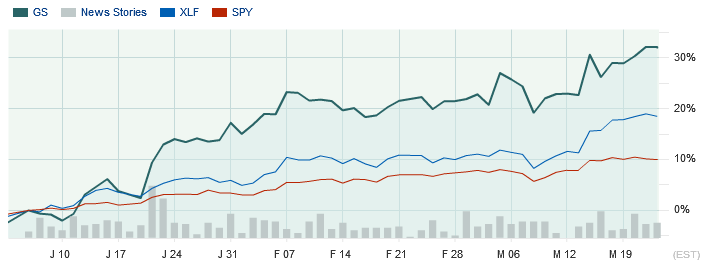
So with Goldman Sachs in mind, take a look at this year-to-date chart for Goldman, the SPDR S&P 500 ETF (SPY) and the Financial Sector ETF (XLF).
Here you are, making an early and successful call on the comeback of the financial sector and doing very nicely, outperforming both the S&P as well as the financial sector, where Goldman Sachs belongs.
But in this very real-world scenario, you wake up in the morning of March 14 with CNBC reading the op-ed piece while Goldman’s stock is sliding down. On the day, Goldman dropped 3.35%, while both SPY and XLF were about flat — negative 0.11% and positive 0.13% respectively.
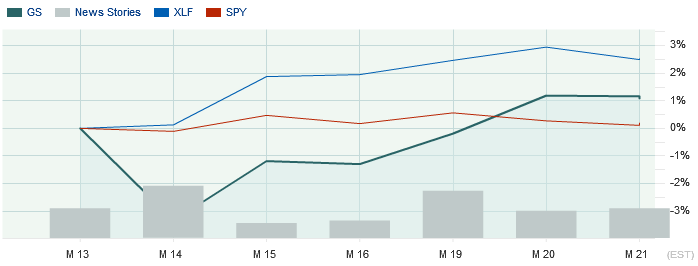
Moving further along, the chart below shows the numbers from March 13 through today:
Goldman has still not recovered, and it has underperformed the financial sector ETF XLF. Clearly, six days don’t make it a strategy, but we should draw an appropriate lesson: Investing in individual names provides higher risk.
This is not about siding with Greg Smith or not, and it is not whether Goldman Sachs deserves blame or not. I don’t have internal details, and I simply don’t know, as I don’t have enough information. What I am writing about is being a prudent, risk-averse investor and confirming that even the best or the most popular companies can appear on the front page of a newspaper with bad news.
The key is to diversify away from an individual company, while aiming to capture the economic and business reasons for why a certain stock within a specific industry or economic sector would outperform the market. In this particular case, it would have been better to be invested in XLF, which encompasses the entire S&P 500 financial sector, or a more specifically the SPDR S&P Bank ETF (KBE), the financial industry group banking ETF.
__
At the time of publication, Gurvich and Rockledge clients had a long position in XLF and a short position in SPY.
Comments


Leave a Reply
You must be logged in to post a comment.